Evaluation phase
in the Netherlands
The trial evaluation contained three dimensions: trial, solution and crisis management. According to the identified gaps and research questions, different key performance indicators (KPI) were defined and evaluation data collected.
The Crisis Management dimension was evaluated for each of the four blocks of the threat and impact phase separately comparing the baseline and the innovation line. None of the selected solutions closed gap 1 (on resource planning) as initially intended. Solutions 3Di, SIM-CI and ATSA-ZKI, although very useful in dealing with a (potential) flooding, do not close gap 2 (on information sharing) as initially intended. Solution CrisisSuite however was a perfect choice for gap 2. The experiences in the trial even led to initiatives to formally connect both solutions: the legacy system LCMS which is currently used at SRH and CrisisSuite. Solution HumLog was suited for gap 3, however, only in the threat phase. In all four blocks, the practitioners were more focussed on performing the tasks the were given and ‘forgot’ to use the solutions for these tasks. A recommendation would therefore be to use a directive approach in formulating the assignment and specify the requested outputs (how, when and where) for the participants so that they are “forced” to use the solutions.

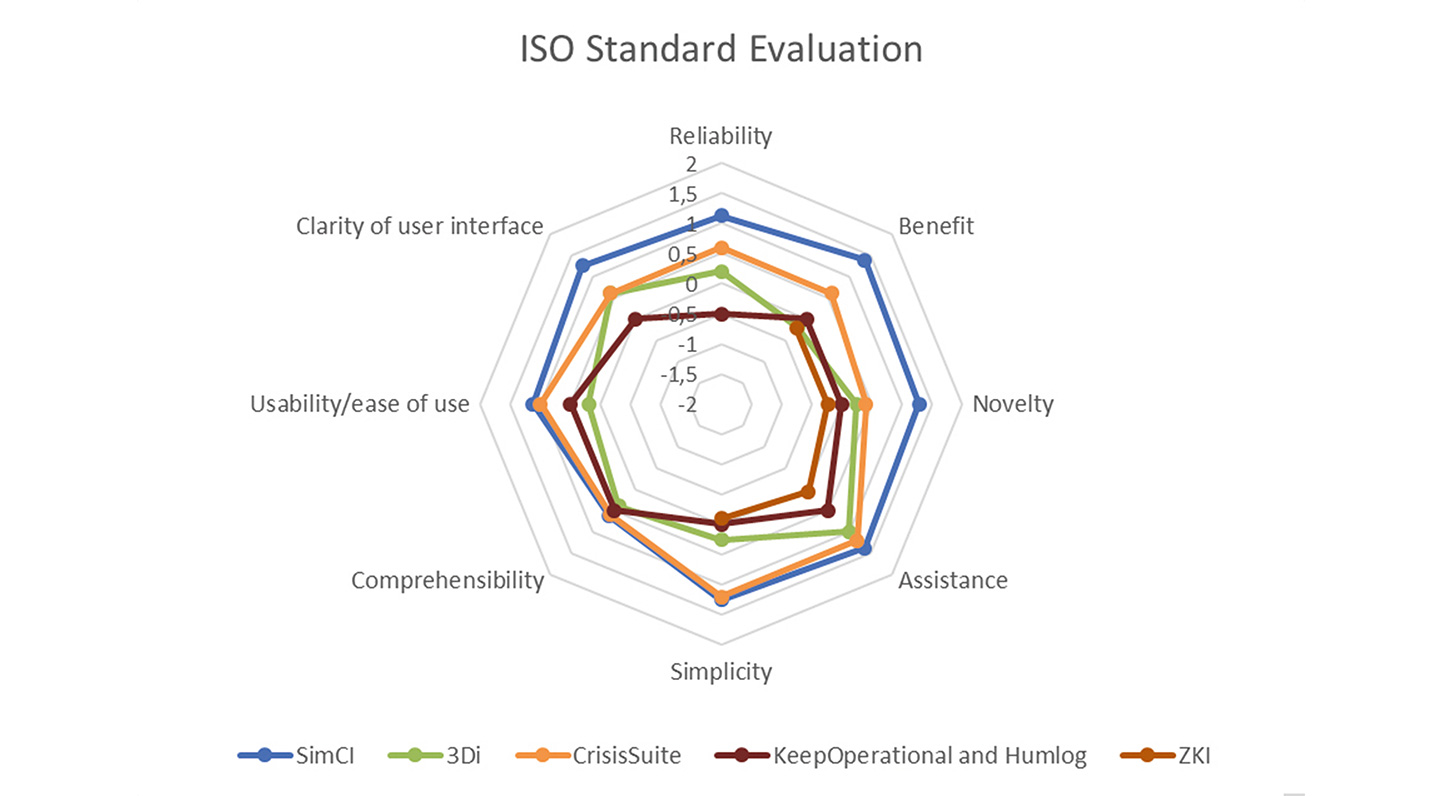
In the first part of the solution dimension generic indicators were derived from the international standard ISO 924-11 (1), where usability is “composed of effectiveness, efficiency and satisfaction”. The figure presents the average rates of the solutions features assessed by the practitioners during trial 4. The features included in the questionnaire fulfilled by the practitioners was based on ISO standard. Individual evaluations of each solution were also created taking into account specific KPIs. The graph on the right shows the average ratings of the individual solutions in different colors. SIMCi scored best of all solutions in all categories and received, for example, the value 1.5 (-2: poor to +2: very good).
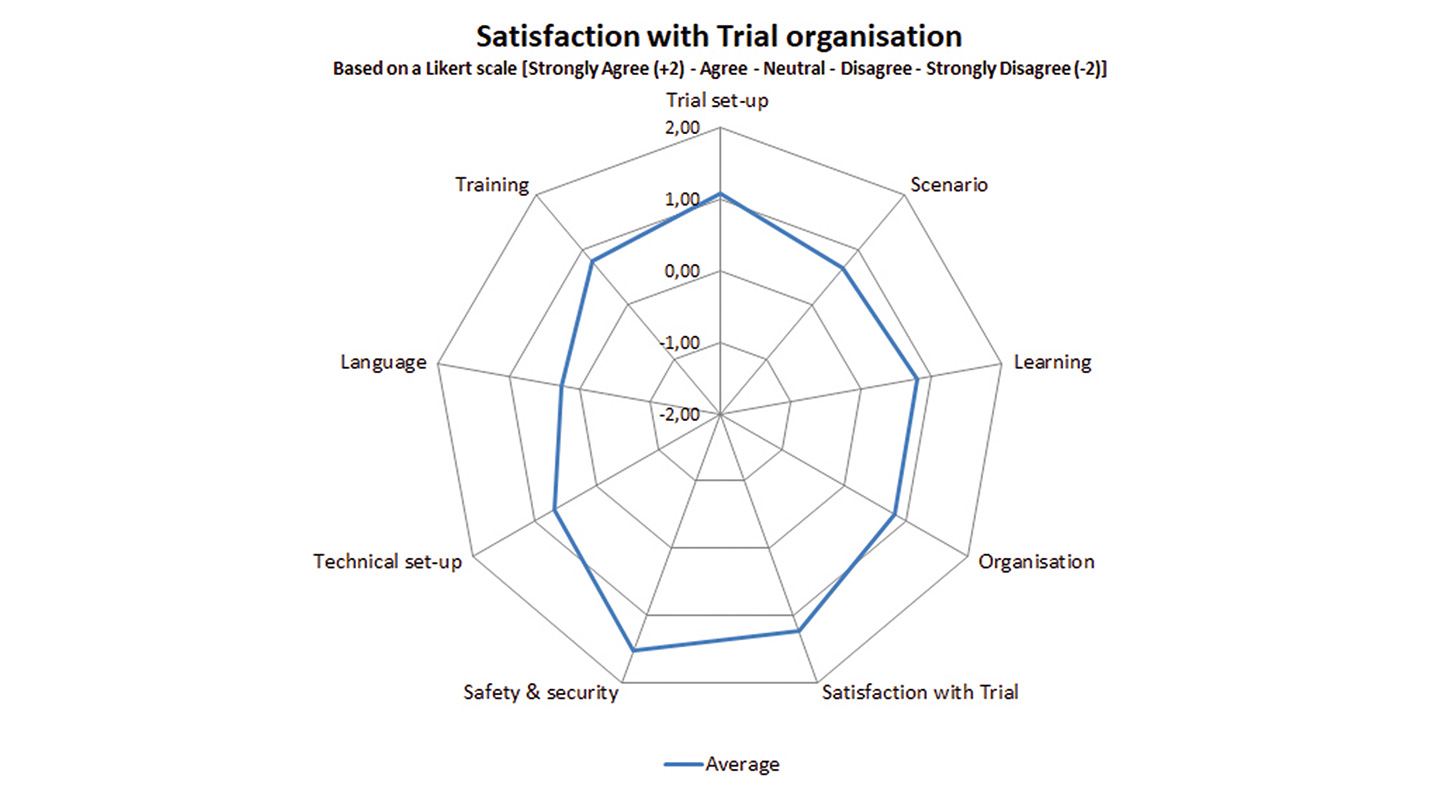
One part of the trial dimension questionnaire addressed the perception with trial organization. Looking at the average of all answers, the respondents rather agreed that they were satisfied with the organisation. The graph on the right shows the satisfaction with the trial organization. The scale ranges from -2: bad to +2: very good. For example, the scenario was given an average score of about 0.6 and the trial set-up a score of over 1.0.


