your data set in order to
prepare the synthesis
practitioner coordinator
In a nutshell
What this step
is about
Here you will structure, visualise and identify patterns. Furthermore you will put your data in a first relation to your KPIs. First: Structure - start with the sessions of your trial, the three dimensions and outcomes for the solutions. Second: aggregate and visualise data; create relevant graphs or pie charts. Third: patterns - what is standing out? Don´t hesitate to draw first conclusions and dig deeper to see if your assumptions turns into facts or into unexpected phenomena.

In depth
All you need to know
about this step
Analysis. It may sound like you need a white coat and a chemistry lab, but this is not necessarily the case. All you need is your high quality data and your brain power.
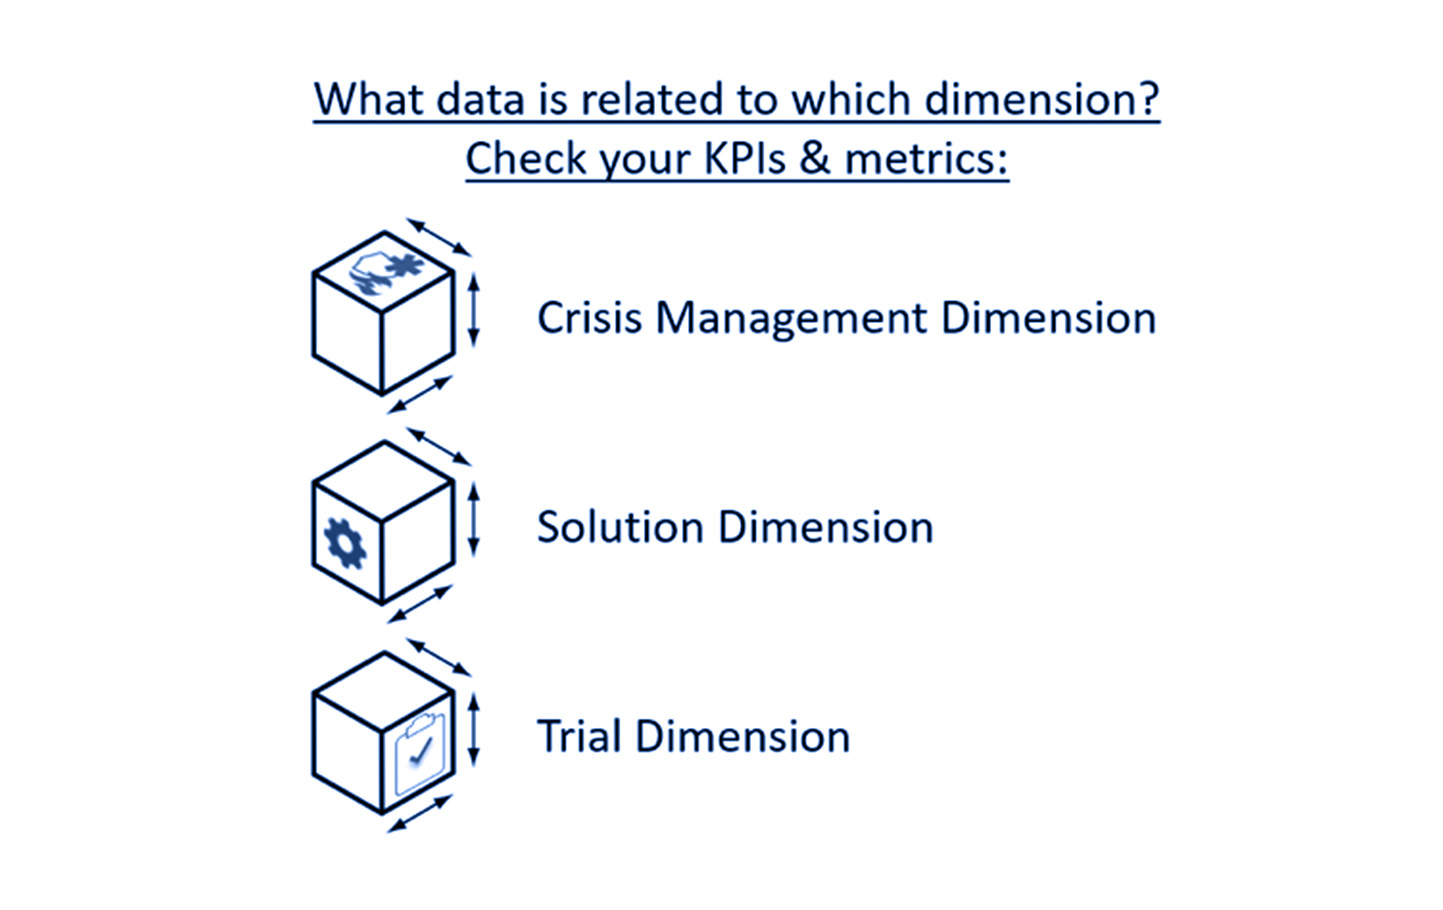
Here you want your data separated in the three dimensions: trial, solution and CM. Look at your data collection plan and especially at the KPIs and metrics you defined before.
What kind of data did you collect that can be related to those KPIs and metrics. How can you match them? If you e.g. wanted to know something about time (did this solution speed up the process), then gather all data you collected about time in the steps you are interested it.
Are there any patterns? Visualise them! Which dimension do they address? Data analysis is mostly about finding relations! By creating appropriate charts you can already draw some preliminary conclusions and the deep dive knowledge gathering in the next step will be a breeze.
Methods
Data aggregation, visualisation,
comparative analysis, if appropriate
further specific qualitative and
quantitative data analysis techniques,
societal impact assessment,
research ethics
Tools
Output
Valid information and conclusions
Checklist
- Data of each session structured according to the three dimensions
- Data related to KPIs and metrics
- Data visualised
- Preliminary pattern identification done
- Make sure to process and store the data according to the predefined agreements (e.g. anonymisation etc.) as well as to the GDPR requirements.